Do the tables match our brand?
Yes. They render in your style, alongside your charts and slides.
Clear, accessible, on-brand tables composed from your data.
Learn next: Datasets · Data Visualization Studio · Brand System & Render Engine · Expressions
A studio that produces clean, accessible tables styled in your brand, from your data.
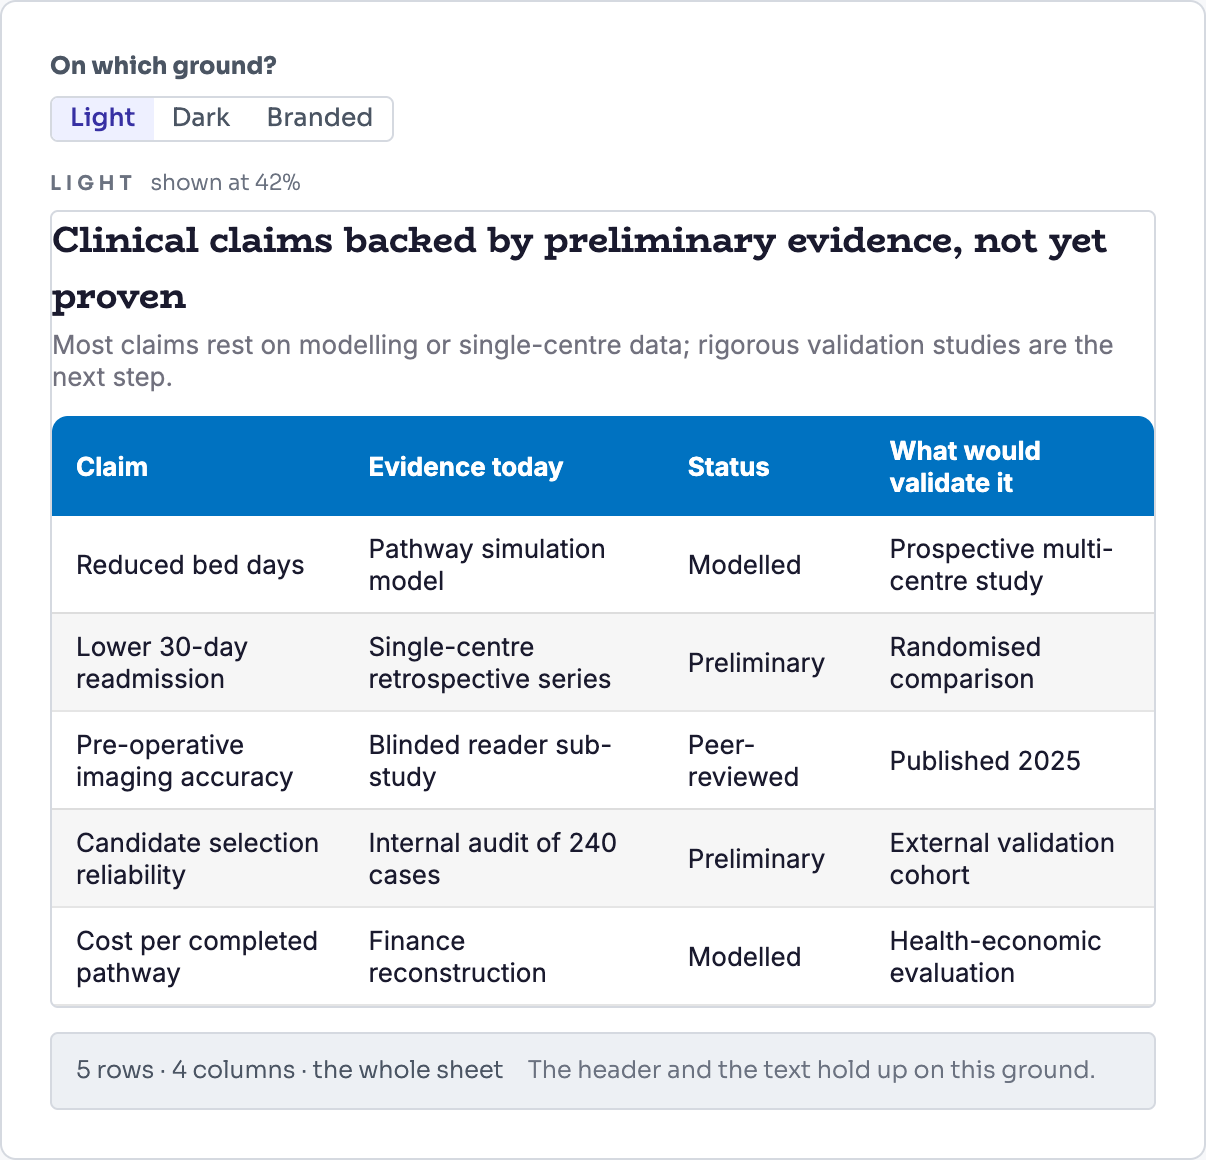
A table should match everything around it and stay readable. Rebuilding tables by hand to look right is time nobody should spend.
A table is defined as a specification, baked to an image through the render path in your style, and placed into an Expression.
Yes. They render in your style, alongside your charts and slides.
A table made in the studio is placed on a slide as an image of the table, so its figures cannot be edited on the slide: change them in Tables and place it again. A table composed into an Expression is real text.
A spreadsheet stays a spreadsheet. Gyrium reads it, understands its units, and states what it says, without shredding the grid into loose facts.
Turn a spreadsheet into a branded, accessible chart, ready to place in a deck or a report.
It doesn't export, it renders. Everything you make is assembled from your knowledge and rendered in your design system, element by element.
The work you actually ship. An Expression is a rendered view of your intelligence, in your brand.
The pilot takes a small number of organizations at a time. Bring what you already have.